Andrea Winokur Kotula
  • Home
  • About
  • For Parents
    • Independent Evaluations
    • IEP Assistance
    • School Meetings
    • Program Planning
  • For Schools
    • Staff Development
    • IEP Assistance and Development
    • School Meetings
    • Program Planning
    • Educational Evaluations
    • Evaluation of Reading Programs
  • FAQ
  • Testimonials
  • Blog
  • Contact
  • Link Page

understanding test scores, part 2

7/22/2017

0 Comments

 
Picture

In Part 1, I wrote about the different kinds of test scores. In Part 2, I'll explain how to interpret those scores. As I said in Part 1, I prefer to use standard scores to gauge progress because they’re on an equal interval scale. But what do they mean? To assist with this discussion, consult the diagram below from Part 1:
Picture
The Average Range. To review, about 68 percent of the people who take a standardized test will obtain scores within plus or minus one standard deviation (explained in Part 1). The Wechsler and Stanford-Binet intelligence tests designate the middle 50 percent of the area between plus or minus one standard deviation as the Average range--or 90 to 109 for tests with a mean of 100 and standard deviation of 15. That's the area that many evaluators consider Average, including me. In other words, half the students taking the test will have scores within the Average range and half will have scores that are above or below Average.

However, some researchers and clinicians consider the full 68 percent to be in the Average range, or scores between 85 and 115. Neither interpretation is right or wrong because there isn't agreement in the field. In my opinion, it makes more sense to use the 50 percent figure; it doesn't seem to me that the scores of almost two-thirds of the population are in the Average range.

If 90 to 109 is Average, 80  to 89 is Below Average and 110 to 119 is Above Average.  (FYI, psychologists use the terms Low Average and High Average for Below and Above Average.) It might help you keep track if you make a simple chart of these scores. For example:
Standard Score
Percentile
Interpretation
80-89
9-23
Below Average
90-109
25-73
Average
110-119
75-90
Above Average
Confidence Bands. Moving on from the scores themselves, have you heard people talking about confidence bands? That's an important concept to understand because a single testing may not demonstrate a student's true score, his or her actual ability. The true score is a statistical concept and too complicated to explain here, but the point to understand is that there is some error, some uncertainty in all testing--in the test itself, in the testing conditions, in the student's performance, and so on. To account for this uncertainty, a confidence band is constructed to indicate the region in which a student's true score probably falls. Evaluators can select different levels of confidence for the bands; I use 90 percent. Therefore, I provide a confidence band that indicates the region in which a student's true score probably falls 90 times out of 100. Test publishers usually compute these for users.

Here's an example. Mary obtained a standard score of 97 on a reading test, which is solidly in the Average range (90 to 109). However, although the obtained score on a test gives the best single estimate of a student's ability, a single testing may not necessarily demonstrate the true score. Mary's standard score confidence band is 91 to 104.

Subtests and Scaled Scores. Many tests measure different parts of a domain with component tests called subtests. Sometimes the subtests yield scaled scores, which are standard scores that range from 1 to 19 points with a mean of 10 and a standard deviation of 3. Scaled scores between 8 and 12 are considered Average.

Composite Scores. If they have high statistical reliability, subtest scores may stand alone. If not, they should only be reported as part of a composite score. A composite score is computed by combining related subtests--for example, subtests that assess word recognition and reading comprehension or math computation and applications.

Because composite scores are generally more statistically reliable than subtest scores, they are sometimes the only score that should be considered. However, it is better to use tests with highly reliable subtests when they are available because composite scores can mask the differences among the subtest scores. For example, Richard obtained these subtest scores on a recent reading test: Word Recognition, 73; Pseudoword Decoding, 78; and Reading Comprehension, 107. The 73 and 78 scores were in the Borderline range (70-79), and the 107 was in the Average range. The composite score was 82, in the Below Average range. However, none of the three subtests was Below Average. Because of the variability between the word recognition and decoding scores on the one hand and the comprehension score on the other, it would have been more accurate to not provide a composite score in this case.

Here's another example. Nalia obtained two math scores recently: 100 in Math Applications (Average range) and 84 in Math Computation (Below Average) with a composite score of 90, which is at the bottom of the Average range. However, there was a 16-point difference between the two subtest scores, and it would be incorrect to say that Nalia's math performance was in the Average range when she was struggling with computation. Yet sometimes this kind of difference isn't explained in an evaluation report, so you'll need to read carefully and critically.

I've presented quite a bit of technical information in this blog post. Please let me know in the Comments below if you have any questions! And feel free to share any ideas you have for future posts.


0 Comments

understanding test scores, part 1

6/22/2017

0 Comments

 
Picture

In Part 1, I discuss the different kinds of test scores and what they mean and don't mean. In Part 2, I'll address how to interpret scores--what's considered average, confidence bands, the differences between composite and subtest scores, and so on.

The array of test scores in an evaluation report can be confusing. On standardized tests, the number correct is called the raw score. A raw score by itself is meaningless because it’s not the percentage correct; it’s just the number correct, and different tests have a different number of items. So publishers convert the raw scores into derived scores to compare a student’s performance to that of other students his age in the norm group—the people the test was standardized on. There are several kinds of derived scores. Before I discuss a few of them, I need to introduce some statistics. I know this is technical, but bear with me because it will help in the end!
 
Most psychological and educational test results fall within the normal or bell shaped curve. The normal curve is divided into standard deviations that measure the distance from the mean (the average score). In the diagram below, you can see that about 68 percent of the population will have scores between plus and minus one standard deviation (pink area). An additional 27 percent will have scores between plus/minus two standard deviations (about 95 percent; pink and blue areas). And 4 percent more will have scores between plus/minus three standard deviations (about 99 percent; pink, blue, and yellow areas). Now pat yourself on the back for getting through this section!
Picture
The reason we care about all this is because some derived scores are better than others, depending on your purpose. When interpreting test results, I prefer standard scores because they fall along an equal interval scale. Many educational and psychological tests--including the Wechsler intelligence tests--have a mean of 100 and a standard deviation of 15, so I'm using that mean and standard deviation on the diagram above and for this blog post. That means that there will always be 15 points between any two standard deviations. And because of the equal interval scale, we can compare scores across tests given in different years and across different tests that have the same mean and standard deviation. For example, we can compare an educational test to an IQ test or to a different educational test.

Now let’s look at percentile rankings. A percentile ranking means that the score exceeds a particular percent of the other scores obtained by students of the same age in the normative sample. For example, I can say that a student obtained a standard score of 100, which is better than 50 percent of the students his age in the normative group. In other words, I can use a percentile ranking to explain a standard score. But be aware that percentile rankings are not on an equal interval scale, and they’re widely misused and misunderstood. I'll explain.

First, a percentile ranking is NOT the percentage correct. It has nothing to do with the correct vs. incorrect responses to the test. Second, because percentiles don’t have equal distances between units, they can’t correctly be added or subtracted to indicate growth or lack of growth. This is important. Let's assume that Julie obtained a standard score of 100 last year on her reading test. When she was retested recently, she obtained a score of 115. That's a difference of one standard deviation. The corresponding percentiles between Julie's two standard scores are 50 and 84 (see diagram above), or a change of 34 percentile rankings. Now look at the percentile differences between Alan's standard score of 70 last year and his recent retesting of 85, which is again a 15 standard score point gain--one standard deviation. However, Alan's corresponding percentiles are 2 and 16, or growth of only 14 percentile rankings. Note that the number of percentiles between Julie's two scores is different than between Alan's even though in both cases the scores are one standard deviation apart. When we examine the percentile rankings, it looks as if Alan didn't make much progress, doesn't it? There's only a 14-percentile gain compared to 34. But actually there isn't less growth. It's still a one standard deviation change. See what I mean? That's a problem with misinterpreting percentile rankings.

In addition, there’s more distance between percentile rankings as you get farther from the mean, in either direction. Look at Mark's standard score when he was tested the first time (55) and again two years later (70)--still 15 standard score points and one standard deviation between the two scores. Yet the percentile rankings range from only .1 to 2--just 1.9 percentiles! Think about that: The comparison between two scores will have a different meaning depending on the position on the percentile scale, another problem with comparing percentile rankings! Be careful when someone tells you there's a lot of growth (or conversely very little growth) between two percentile rankings. Instead ask to compare standard scores.

Now let’s look at my least favorite scores, grade or age equivalents. These are even more misused than percentiles. (For simplicity, I'll refer to grade equivalents, but the same arguments apply to age equivalents.) A grade equivalent indicates that the number of items that someone answered correctly is the same as the average score for students of that grade in the test standardization group; note that a grade equivalent does not indicate which items were correct or the level of the items.

Here are some of  the issues with using grade equivalents. (1) The use of grade equivalents leads us to make incorrect comparisons. Grade equivalents are usually divided into tenths of a grade, but a fourth grader with a 7.6 grade equivalent, for example, is probably not performing like seventh graders in their sixth month. Grade equivalents are not grade levels. The grade equivalent only means that the fourth grader shares the same number correct on the test—which is not the same thing as performing at the same grade level. (Sometimes those skills aren’t even taught in the grade equivalent grade.) (2) Publishers often determine many grade equivalents by interpolation or extrapolation, or both; there may not have been children at all the grade equivalents in the normative sample—and certainly not enough to be statistically sound. (3) Grade equivalents assume that growth is constant throughout the school year, which is probably not true. (4) Similar to the last point but slightly different: Academic growth flattens as children get older (less change), so the difference between grade equivalents at second and third grade, for example, is probably not the same as the difference between seventh and eighth grade scores.  (5) The same grade equivalent on different tests may not mean the same thing. In fact, grade equivalents vary from test to test, subtest to subtest within a test, and subject to subject.

Therefore, my advice is to use standard scores for most test interpretation and comparisons and use percentiles to explain standard scores. I truly believe we should ignore grade equivalents, and many national organizations suggest that we do just that, including the American Psychological Association and the International Literacy Association. Even test publishers often say that they include them only because some states require them.

Please comment below if this was helpful or if you have any questions. I'll continue this discussion in Part 2.


0 Comments

    Author

    Dr. Andrea Winokur Kotula is an educational consultant for families, advocates, attorneys, schools, and hospitals. She has conducted hundreds of comprehensive educational evaluations for children, adolescents, and adults.

    Archives

    July 2017
    June 2017
    May 2017
    March 2017
    February 2017
    January 2017

    Categories

    All
    Assessment
    Cursive
    Evaluations
    Handwriting
    Reading
    Special Education


      please Enter your name and email address to subscribe to the blog and receive email notifications of new posts.

    Submit

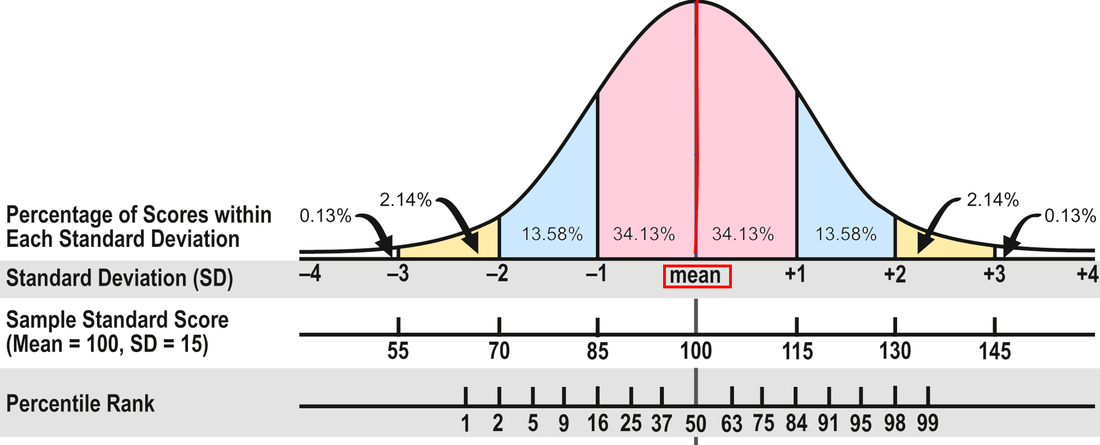
The intention of this website is to provide useful information but not legal advice. Every case is different. Please consult a special education attorney for legal advice.

Professional Associations

Picture
Picture


Office in South Kingstown, RI

15 Dixon Street
Peace Dale, RI 02879
401.789.8260


  • Home
  • About
  • For Parents
    • Independent Evaluations
    • IEP Assistance
    • School Meetings
    • Program Planning
  • For Schools
    • Staff Development
    • IEP Assistance and Development
    • School Meetings
    • Program Planning
    • Educational Evaluations
    • Evaluation of Reading Programs
  • FAQ
  • Testimonials
  • Blog
  • Contact
  • Link Page