
In Part 1, I wrote about the different kinds of test scores. In Part 2, I'll explain how to interpret those scores. As I said in Part 1, I prefer to use standard scores to gauge progress because they’re on an equal interval scale. But what do they mean? To assist with this discussion, consult the diagram below from Part 1:

The Average Range. To review, about 68 percent of the people who take a standardized test will obtain scores within plus or minus one standard deviation (explained in Part 1). The Wechsler and Stanford-Binet intelligence tests designate the middle 50 percent of the area between plus or minus one standard deviation as the Average range--or 90 to 109 for tests with a mean of 100 and standard deviation of 15. That's the area that many evaluators consider Average, including me. In other words, half the students taking the test will have scores within the Average range and half will have scores that are above or below Average.
However, some researchers and clinicians consider the full 68 percent to be in the Average range, or scores between 85 and 115. Neither interpretation is right or wrong because there isn't agreement in the field. In my opinion, it makes more sense to use the 50 percent figure; it doesn't seem to me that the scores of almost two-thirds of the population are in the Average range. If 90 to 109 is Average, 80 to 89 is Below Average and 110 to 119 is Above Average. (FYI, psychologists use the terms Low Average and High Average for Below and Above Average.) It might help you keep track if you make a simple chart of these scores. For example:
Confidence Bands. Moving on from the scores themselves, have you heard people talk about confidence bands? That's an important concept to understand because a single testing may not demonstrate a student's true score, his or her actual ability. The true score is a statistical concept and too complicated to explain here, but the point to understand is that there is some error, some uncertainty, in all testing--in the test itself, in the testing conditions, in the student's performance, and so on. To account for this uncertainty, a confidence band is constructed to indicate the region in which a student's true score probably falls. Evaluators can select different levels of confidence for the bands; I use 90 percent. Therefore, I provide a confidence band that indicates the region in which a student's true score probably falls 90 times out of 100. Test publishers usually compute these for users.
Here's an example. Mary obtained a standard score of 97 on a reading test, which is solidly in the Average range (90 to 109). However, although the obtained score on a test gives the best single estimate of a student's ability, a single testing may not necessarily demonstrate the true score. Mary's standard score confidence band is 91 to 104. Subtests and Scaled Scores. Many tests measure different parts of a domain with component tests called subtests. Sometimes the subtests yield scaled scores, which are standard scores that range from 1 to 19 points with a mean of 10 and a standard deviation of 3. Scaled scores between 8 and 12 are considered Average. Composite Scores. Subtest scores may stand alone if they have high statistical reliability. If not, they should only be reported as part of a composite score. A composite score is computed by combining related subtests--for example, subtests that assess word recognition and reading comprehension or math computation and applications. Because composite scores are generally more statistically reliable than subtest scores, they are sometimes the only score that should be considered. However, it is better to use tests with highly reliable subtests when they are available because composite scores can mask the differences among the subtest scores. For example, Richard obtained these subtest scores on a recent reading test: Word Recognition, 73; Pseudoword Decoding, 78; and Reading Comprehension, 107. The 73 and 78 scores were in the Borderline range (70-79), and the 107 was in the Average range. The composite score was 82, in the Below Average range. However, none of the three subtests was Below Average. Because of the variability between the word recognition and decoding scores on the one hand and the comprehension score on the other, it would have been more accurate to not provide a composite score in this case. Here's another example. Nalia obtained two math scores recently: 100 in Math Applications (Average range) and 84 in Math Computation (Below Average) with a composite score of 90, which is at the bottom of the Average range. However, there was a 16-point difference between the two subtest scores, and it would be incorrect to say that Nalia's math performance was in the Average range when she was struggling with computation. Yet sometimes this kind of difference isn't explained in an evaluation report, so you'll need to read carefully and critically. I've presented quite a bit of technical information in this blog post. Please let me know in the Comments below if you have any questions! And feel free to share any ideas you have for future posts.
0 Comments
 In Part 1, I discuss the different kinds of test scores and what they mean and don't mean. In Part 2, I'll address how to interpret scores--what's considered average, confidence bands, the differences between composite and subtest scores, and so on. The array of test scores in an evaluation report can be confusing. On standardized tests, the number correct is called the raw score. A raw score by itself is meaningless because it’s not the percentage correct; it’s just the number correct, and different tests have a different number of items. So publishers convert the raw scores into derived scores to compare a student’s performance to that of other students his age in the norm group—the people the test was standardized on. There are several kinds of derived scores. Before I discuss a few of them, I need to introduce some statistics. I know this is technical, but bear with me because it will help in the end! Most psychological and educational test results fall within the normal or bell shaped curve. The normal curve is divided into standard deviations that measure the distance from the mean (the average score). In the diagram below, you can see that about 68 percent of the population will have scores between plus and minus one standard deviation (pink area). An additional 27 percent will have scores between plus/minus two standard deviations (about 95 percent; pink and blue areas). And 4 percent more will have scores between plus/minus three standard deviations (about 99 percent; pink, blue, and yellow areas). Now pat yourself on the back for getting through this section! 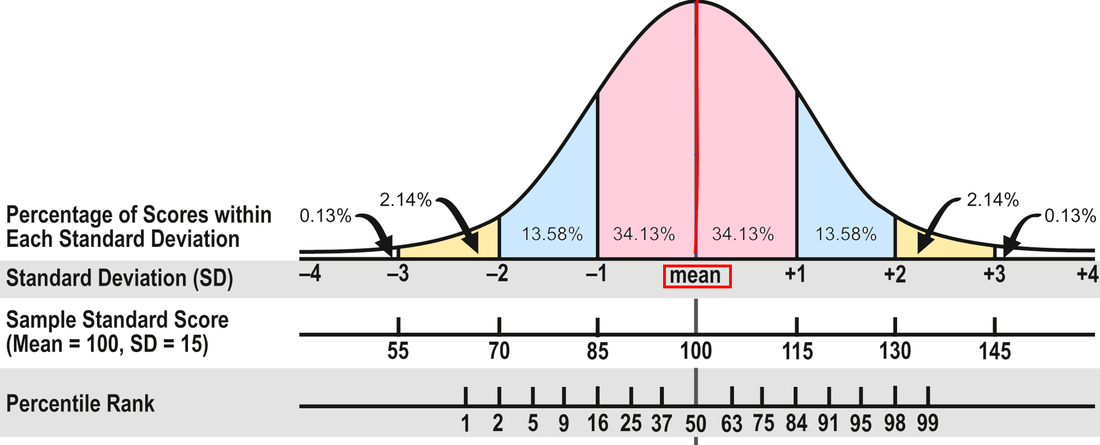
 I worry a lot about the difficulties of administering standardized tests. That might sound a little strange, but assessment data are essential to my work with children, and it concerns me when tests are invalidated, usually by mistake. A standardized test compares a student to a "norm," or the average performance of similar students, generally in a national sample. Part of the process of producing such a test involves "norming," or administering it to a sample of children considered representative of the national population. During norming, the test is administered under specific conditions with very specific instructions to the students in the normative group, and the publishers expect users to later replicate those same conditions and use those same instructions. Otherwise, the results are invalid. It's as simple as that. If test administrators allow extra time or ask leading questions that are not in the test manual or give students advanced preparation or permit multiple attempts beyond those allowed or in many other ways give students advantages that the children in the normative sample did not have--or conversely make the test more difficult--they are invalidating the test results. I often need to read other professionals' evaluation reports, and sometimes the test scores appear to be an extreme over-estimate of the student's ability. I can only guess at the reasons for this because there's no way to know what occurred during test administration. Still, it makes me wonder how carefully the tests were administered. Admittedly this can be confusing because tests can have different administration and scoring rules even when they measure the same task. For example, some oral reading tests count all self-corrected errors, whereas others suggest that we note these corrections but do not count them in the scoring. Some tests have time limits per item administered and some do not. And so on. Yet while this is indeed confusing, it is also the evaluator's responsibility to understand and apply the rules appropriately. I frequently review the test manuals before giving some tests even though I've administered them dozens of times. I just consider it part of the job. But there are other ways to invalidate a standardized test. Some evaluators' reports provide examples of items that students answered incorrectly. At first glance this might seem to make sense; after all, it can be part of an in-depth error analysis. The problem is that this practice can weaken the security and integrity of the test items. I sometimes describe the type of item with sample words that are not part of the actual tests. However, when real test items are shared, there is the possibility that they will become known by teachers or parents, or both, and ultimately by students, which invalidates the test. Parents or teachers may even see these errors and teach them to students--which makes the test useless for re-evaluation at a future time. If the items are directly instructed to a class, this test can be invalidated for all the students in that class. Now you may assume that in the course of a school year, some of these items would naturally be part of the curriculum anyway, and you are certainly correct. Tests are meant to sample the entire domain, e.g., of word meanings or high-frequency words or spelling. But inadvertently teaching some of the items is not the same thing as purposely teaching specific test items. Ultimately what's important here is to carefully guard standardized tests so they can remain useful indicators of student performance. While I believe that informal tests that have not been standardized are also useful, and I include them in my test battery, there's no substitute for good norm-referenced tests. We use standardized tests to compare students to similar students in the national sample; informal tests can flesh out that information to inform instruction. Both are necessary sources of data.  Parents usually suspect that their child has a learning problem, but they don’t always know what to do about it. They often begin by scheduling a conversation with their child’s teacher. Unfortunately, school personnel frequently say that students are doing fine or perhaps that they just need more time to develop. This creates a dilemma for parents; should they override the advice and possibly upset the teacher or just wait and see what happens? Parents want to trust that school professionals know best. The problem is that many times children aren’t doing fine and waiting and seeing rarely has a positive outcome. People don’t grow out of learning disabilities. In fact, the sooner the problem is addressed, the easier it is to help students catch up to their peers. If you suspect a learning problem, it is generally advisable to have your child evaluated. Sometimes parents worry that professionals will label their child and that the label will then become part of the permanent record. While it is true that labels can “stick,” it is also true that confirming what you already suspect, hearing the words spelled out for you, can be a tremendous relief. Parents have told me that many times over the years. Now at last the problems can be addressed with correct school placement, instruction, or accommodations—and sometimes all of these! You might begin by requesting that school district personnel conduct educational and psychological evaluations, or you could have independent evaluators do it. Either way, consider the results and recommendations with a critical eye. Do they support what you’ve been thinking? Does the report suggest detailed ways to help? If the answer to these questions is yes, then that’s terrific! You’re all set. Congratulations for doing this for your child. But maybe after all the waiting and preparation, the testing and report, you find that what you’re reading or being told is a complete surprise. Does it seem too good to be true? Can all the difficulties you’ve noticed really just be in your imagination? There are two possibilities here. On the one hand, perhaps you’ve exaggerated the school difficulties and everything is okay after all. In that case, you can take a breath and relax. But conversely, maybe the evaluator hasn’t dug deeply enough. While hearing that all is well might make you feel better in the short term, it will be small comfort if the problems persist or get worse. I’m so sorry if this is what happened, but it is not uncommon. Sadly, those are often the kinds of cases that are referred to me. So what is a parent to do? The best advice I can give is that if the first opinion doesn’t adequately address your concerns or answer all your questions, ask for a second opinion—an independent evaluation. Then get recommendations from people whom you trust, preferably professionals with experience serving children with learning differences. And carefully research the credentials and experience of the person you choose. Just as in any field, the strengths of evaluators vary. Good luck on this journey to help your child. Please let me know if I can help you. |
The intention of this website is to provide useful information but not legal advice. Every case is different. Please consult a special education attorney for legal advice.
Professional Associations
|
|